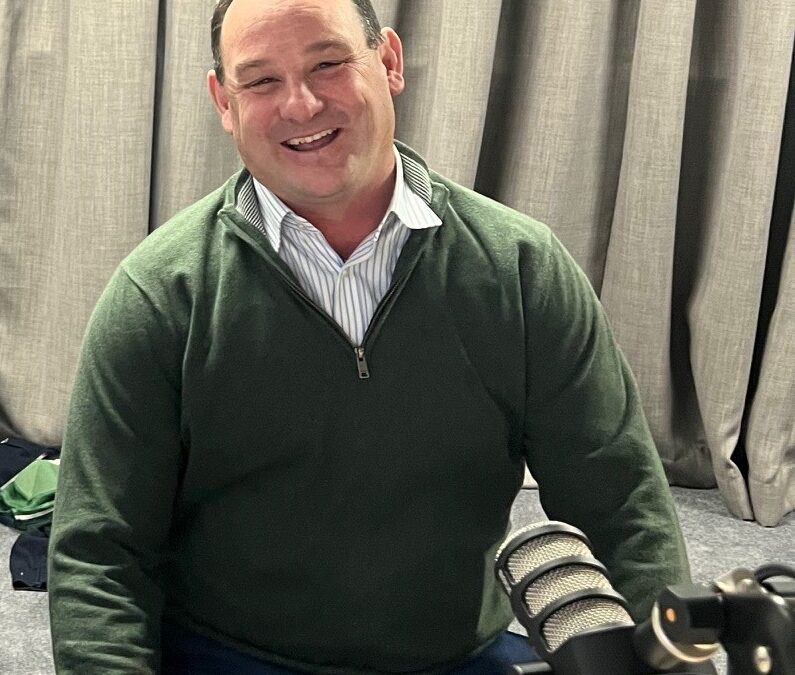
Ben Shi
Supervisor, Business Intel
I’m a Brisbane-based accountant specialising in business intelligence. I thrive on building strong relationships with business leaders and helping them understand their numbers. I'm particularly passionate about transforming data into actionable insights that drive results.
Whether it’s solving cash flow issues, guiding smarter data-driven decisions, or collaborating with a team to uncover fresh perspectives, I love helping clients gain financial clarity and confidence.
I enjoy learning the ins and outs of each client’s business, because success looks different for everyone. I value fresh thinking and take pride in being genuinely invested in helping businesses thrive.
Outside of work, I’m a husband and proud dad to two young boys. On weekends, you’ll find us out camping, at a park, or watching the NBA. I cycle to work most days — one of the perks of living in Brisbane.
I hold a Bachelor of Laws and Commerce (Accounting) and am a qualified Chartered Accountant (CA).